Students: Jordy Ubink, Laurens Roos
Summary
We have created a website that let’s users see how the coronavirus has spread in the Netherlands.
The problem
It was the 23th of March when we started this project. The coronavirus (Sars-Cov-2) was spreading faster and fasting in the word, and so it did in the Nederlands. The governments come with new rules every 2 weeks. To slow the spreading of the virus, the society has to wash their hands often, undertake self-isolation and avoid physical contact with other people.
The problem in the beginning of this project was, that people did not take the virus seriously. When it just arrived in the Netherlands, people thought it was ‘just a flu’. We think that this mindset comes from people thinking that the virus was still ‘far away’ and could not infect or hurt them.
Solution
Our goal was to make people aware that the virus is dangerous and will create serious damage when we are not careful. We had to find a way to show people that the virus is nearby and is not ‘just a flu’.
To tackle this problem, we have created a online dashboard that gives insight into the virus. We show information in ways unique to other sites. Our site is the only one we could find that has the ability to show the amount of covid-19 cases per city by sliding though time.
The creation of the website
This chapter shows a summary of how we created the website.
Finding the right data
Websites online show 1 of 2 different types of data:
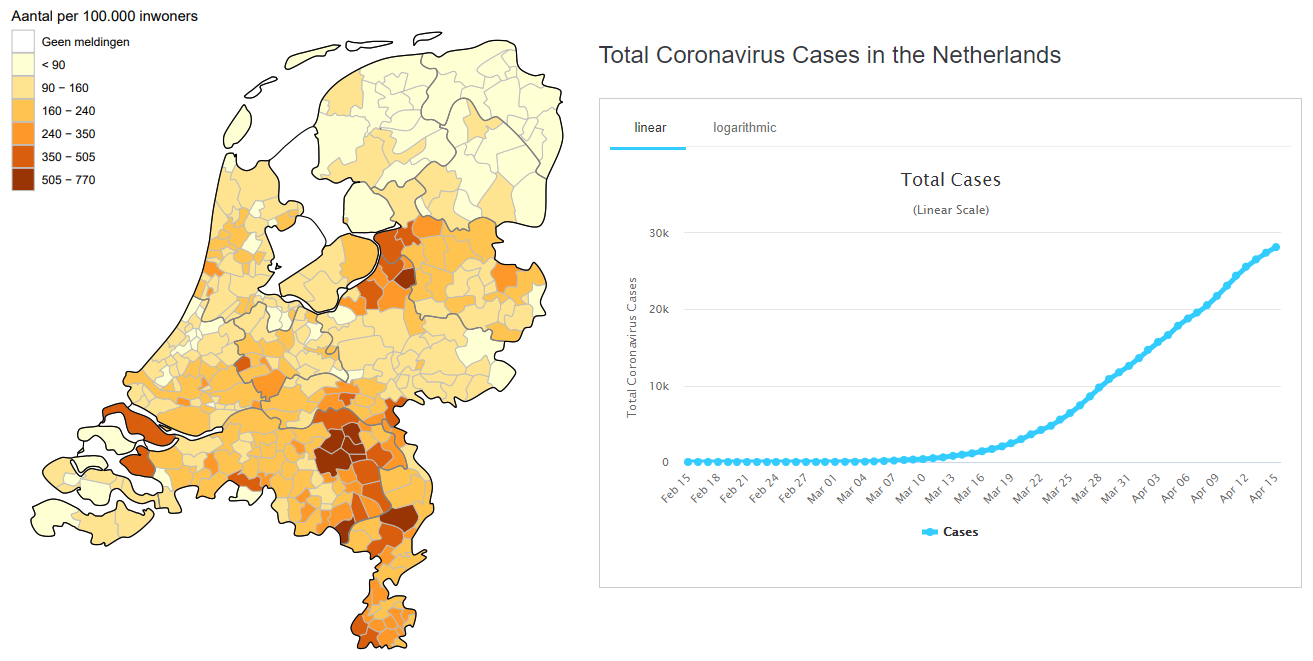
Left: Reported covid-19 cases shown per city on a map. (RIVM)
Right: Reported covid-19 cases in total shown per date in a graph. (Worldometers.info)
As you see above, websites give one of two options. You either see:
* Reported corona cases per city. Or
* Cases per date
We are really interested in combining these two. When you can see the spread of the coronavirus over time on a map, it gives a different impression then when you use one of the two illustrations above.
Sadly, the numbers we need to make such a graph are hard to find. The RIVM updates her website on a daily basis, but remove older information as well. We searched all over the internet for statistics of previous days, without success.. until we’ve found the repository CoronaWatchNL.
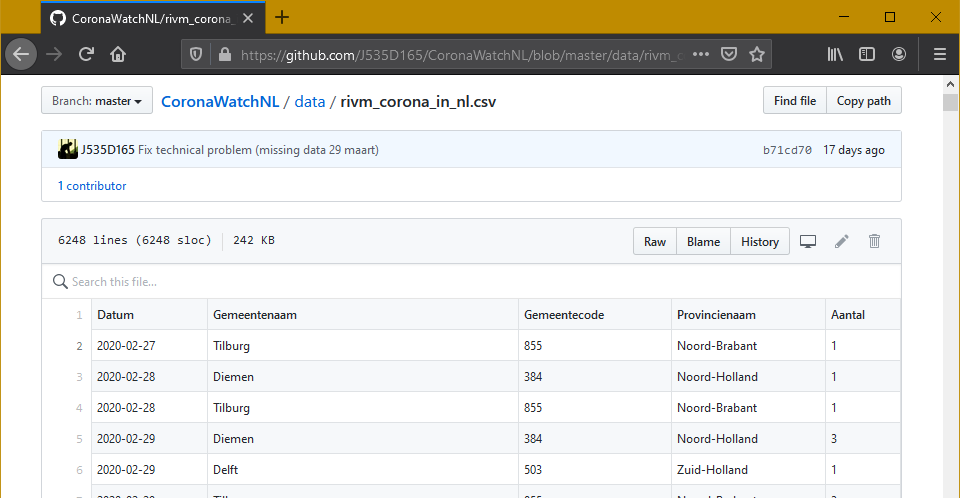
This repository (= online software sharing platform) saves all data published by the RIVM. This has been a huge help for our project.
User interface
Mobile friendly
To create a good website, it should be mobile friendly. The best way to do that, is by creating a ‘mobile first’-layout. We used Bootstrap for our website, which is a easy, yet very effective tool to create a fluid design. Our website shows correct on every screen.
Prevent your website from being too scary
Another aspect of ‘user interface’ is the way you present information. We wanted to make the corona virus seem like a serious issue. However, we do not want to create fear to the user. When presenting information too extreme people will start to overreact. The side-effect can lead to people hoarding supermarkets for toilet paper for example.
On this website, we present the information to the user in a natural way. When you force your opinion on the reader, they psychologically are against your advice. This website uses a more subtle approach to convince the reader.
Technical information
This will get a bit technical, so feel free to skip this chapter if this is all new for you.
Working together on a project
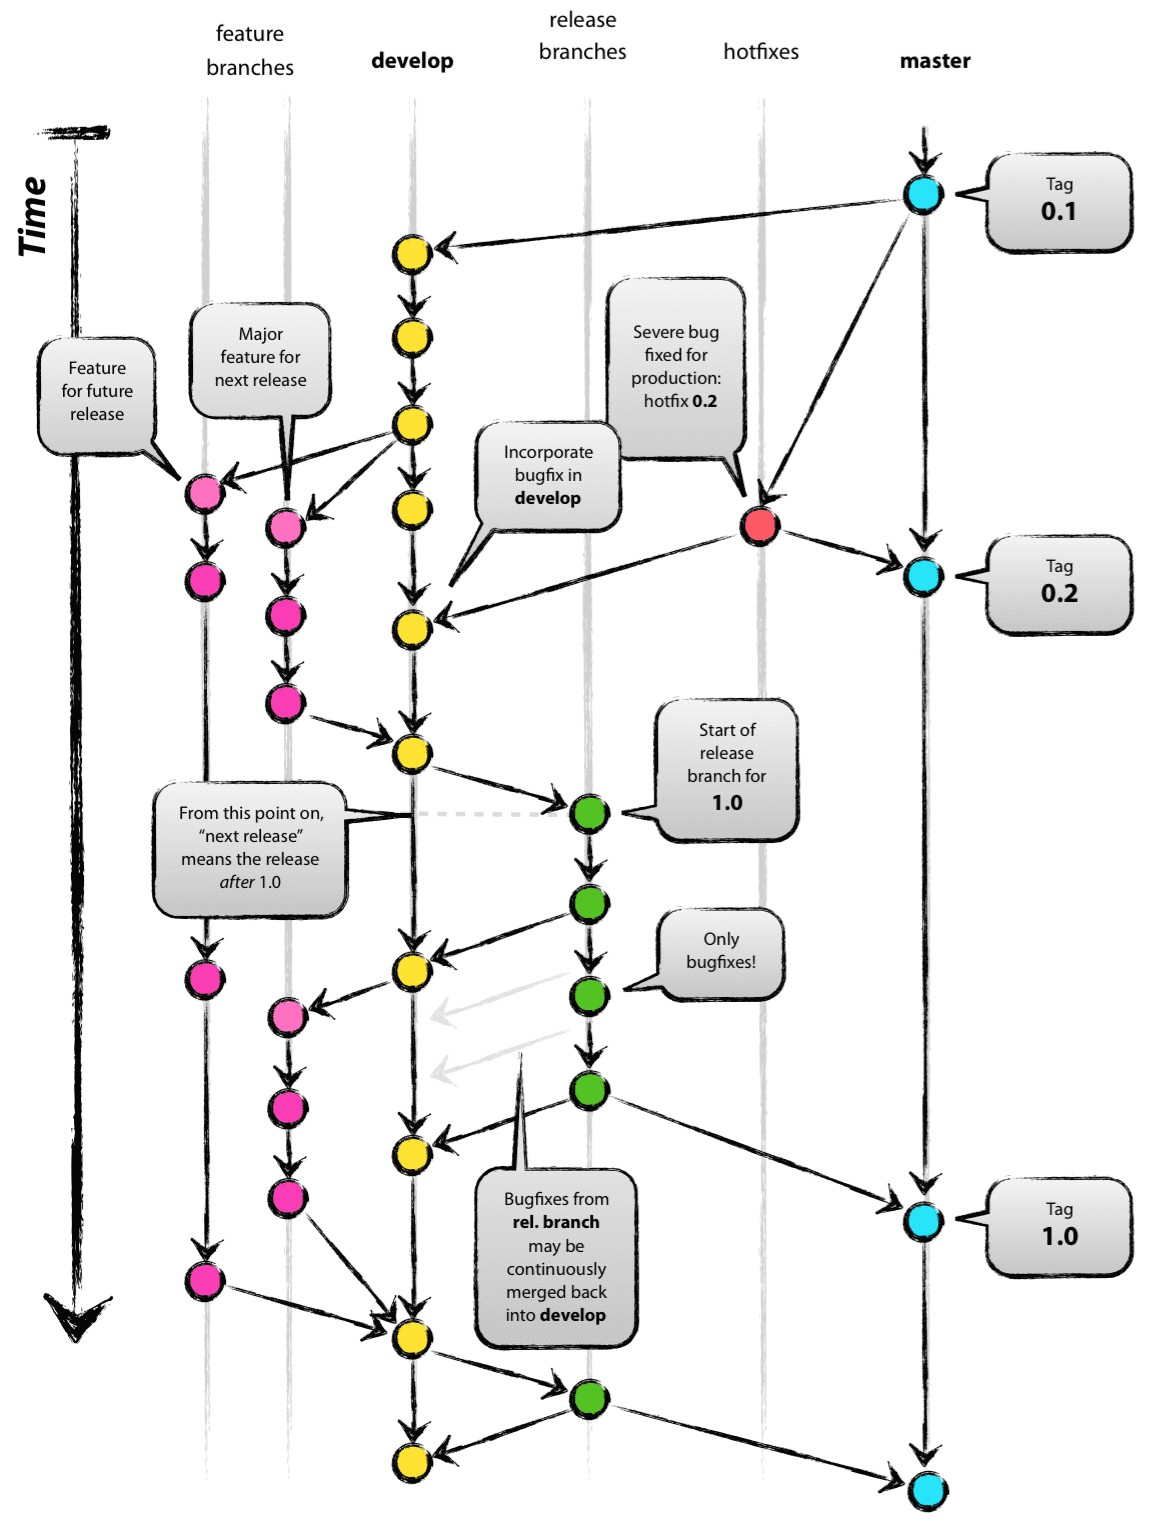
To make our project go as smooth as possible, we used Git (a tool to cooperate on a software project). We followed the git workflow as described in the image below. We have 3 different kind of branches:
• Master branch: This is were the stable server files are stored.
• Multiple Feature branches: This is were functionality is added to the server. We work here when we program.
• Develop branch: This is where we integrate the new created software into the webserver. When everything is works, is reviewed and tested, it can be deployed on the master branch.
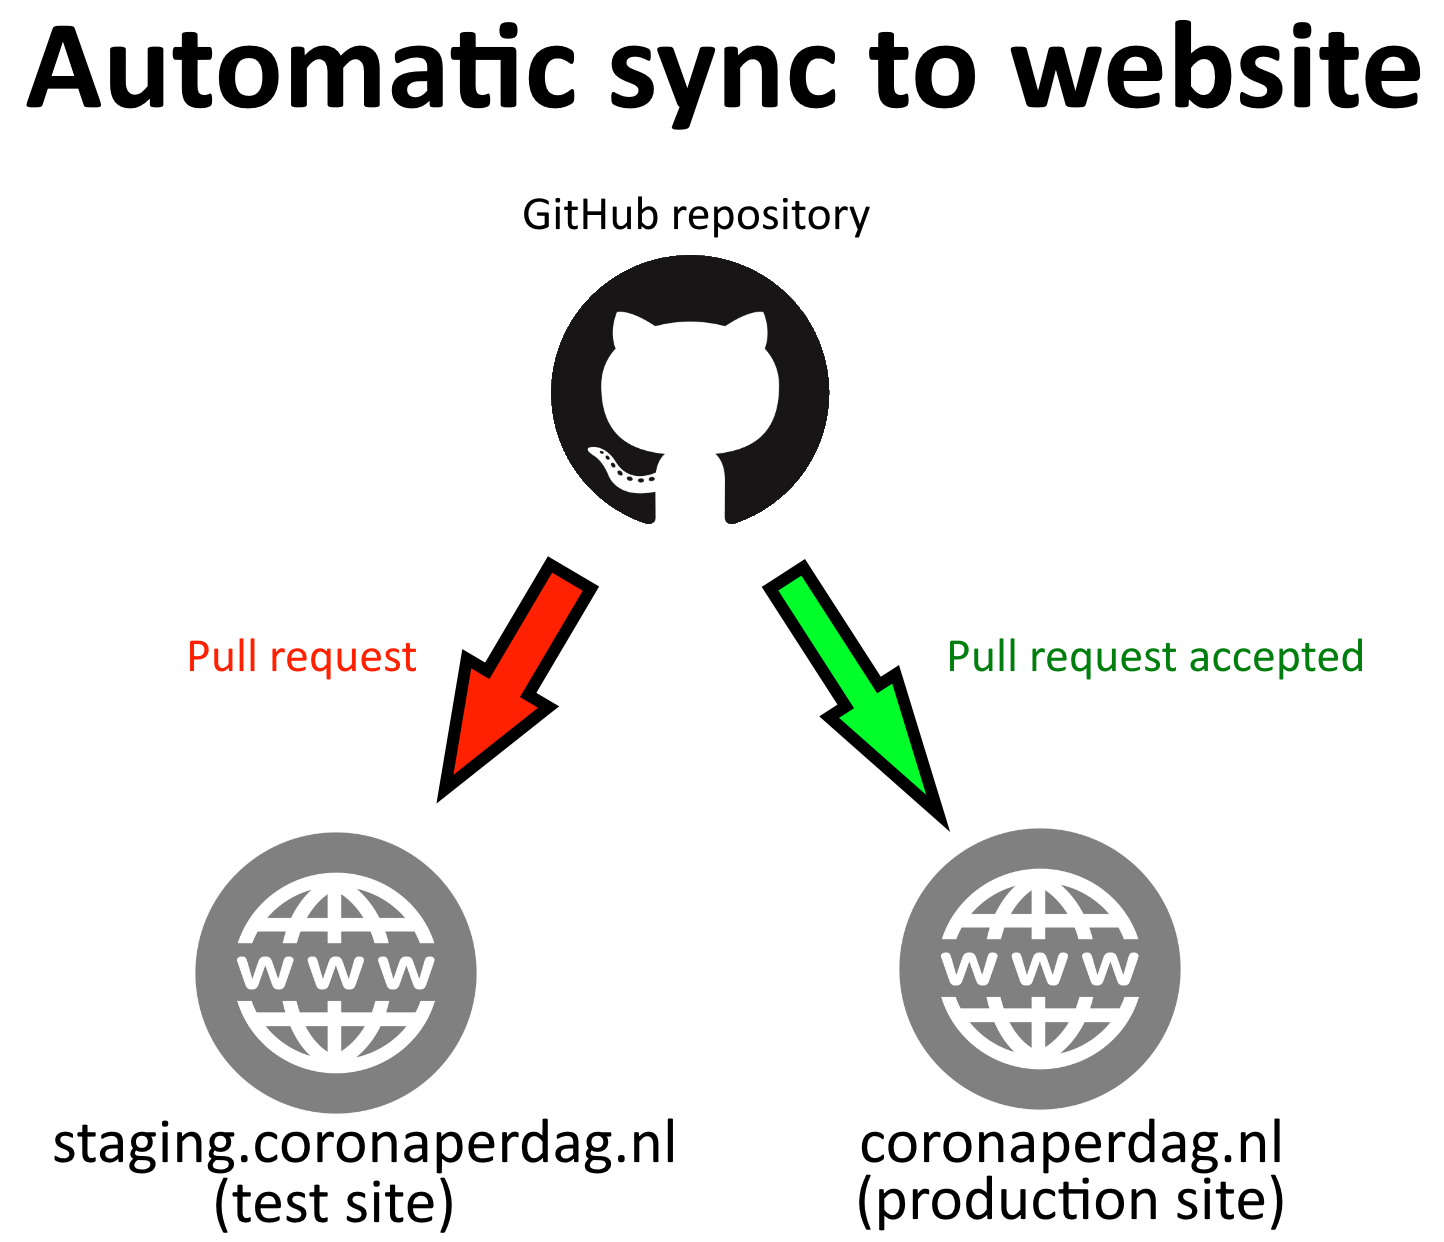
We programmed our repository to automatically publish to our webserver. When we are ready to test and review the new software, it is pushed to the ‘staging’ website. This is a online website under another subdomain. When we have verified that the new software works, we ‘accept’ (merge) it and it will automatically be deployed on the production server.
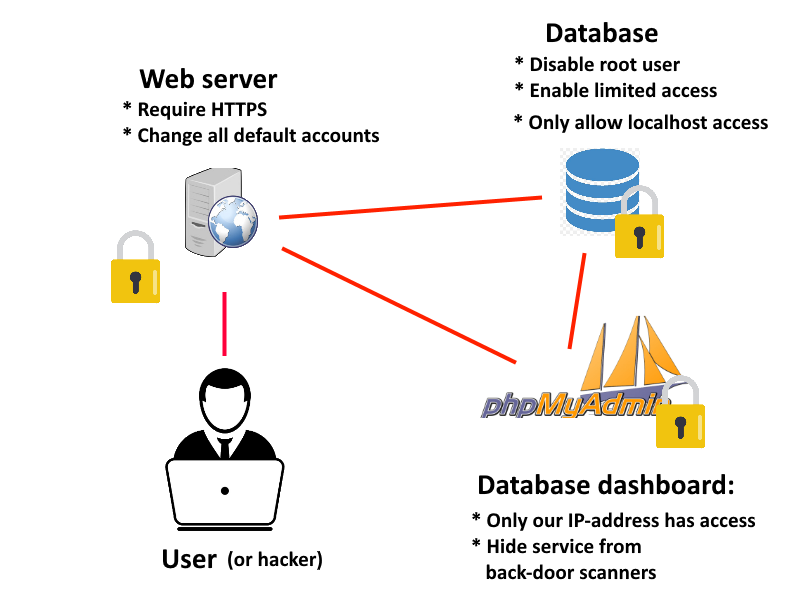
Securing the server
When creating a website, or doing any kind of project that is connected to the internet, you always have to think about security. We tried out best to close all backdoors in our application and took measurements that only we have access to it. We will not go into details about that, but some key points are lists in the image below.
Conclusion
Our goal is achieved. We created a website that shows people that this virus is a real thread and they should take the right measurements against it. We did that by providing information that is ‘closer to home’ in a way that is unique to every other website.
Thanks for reading. This website will receive even more updates in the future and can be viewed at coronaperdag.nl.
.,